OPENING THE FLOODGATES
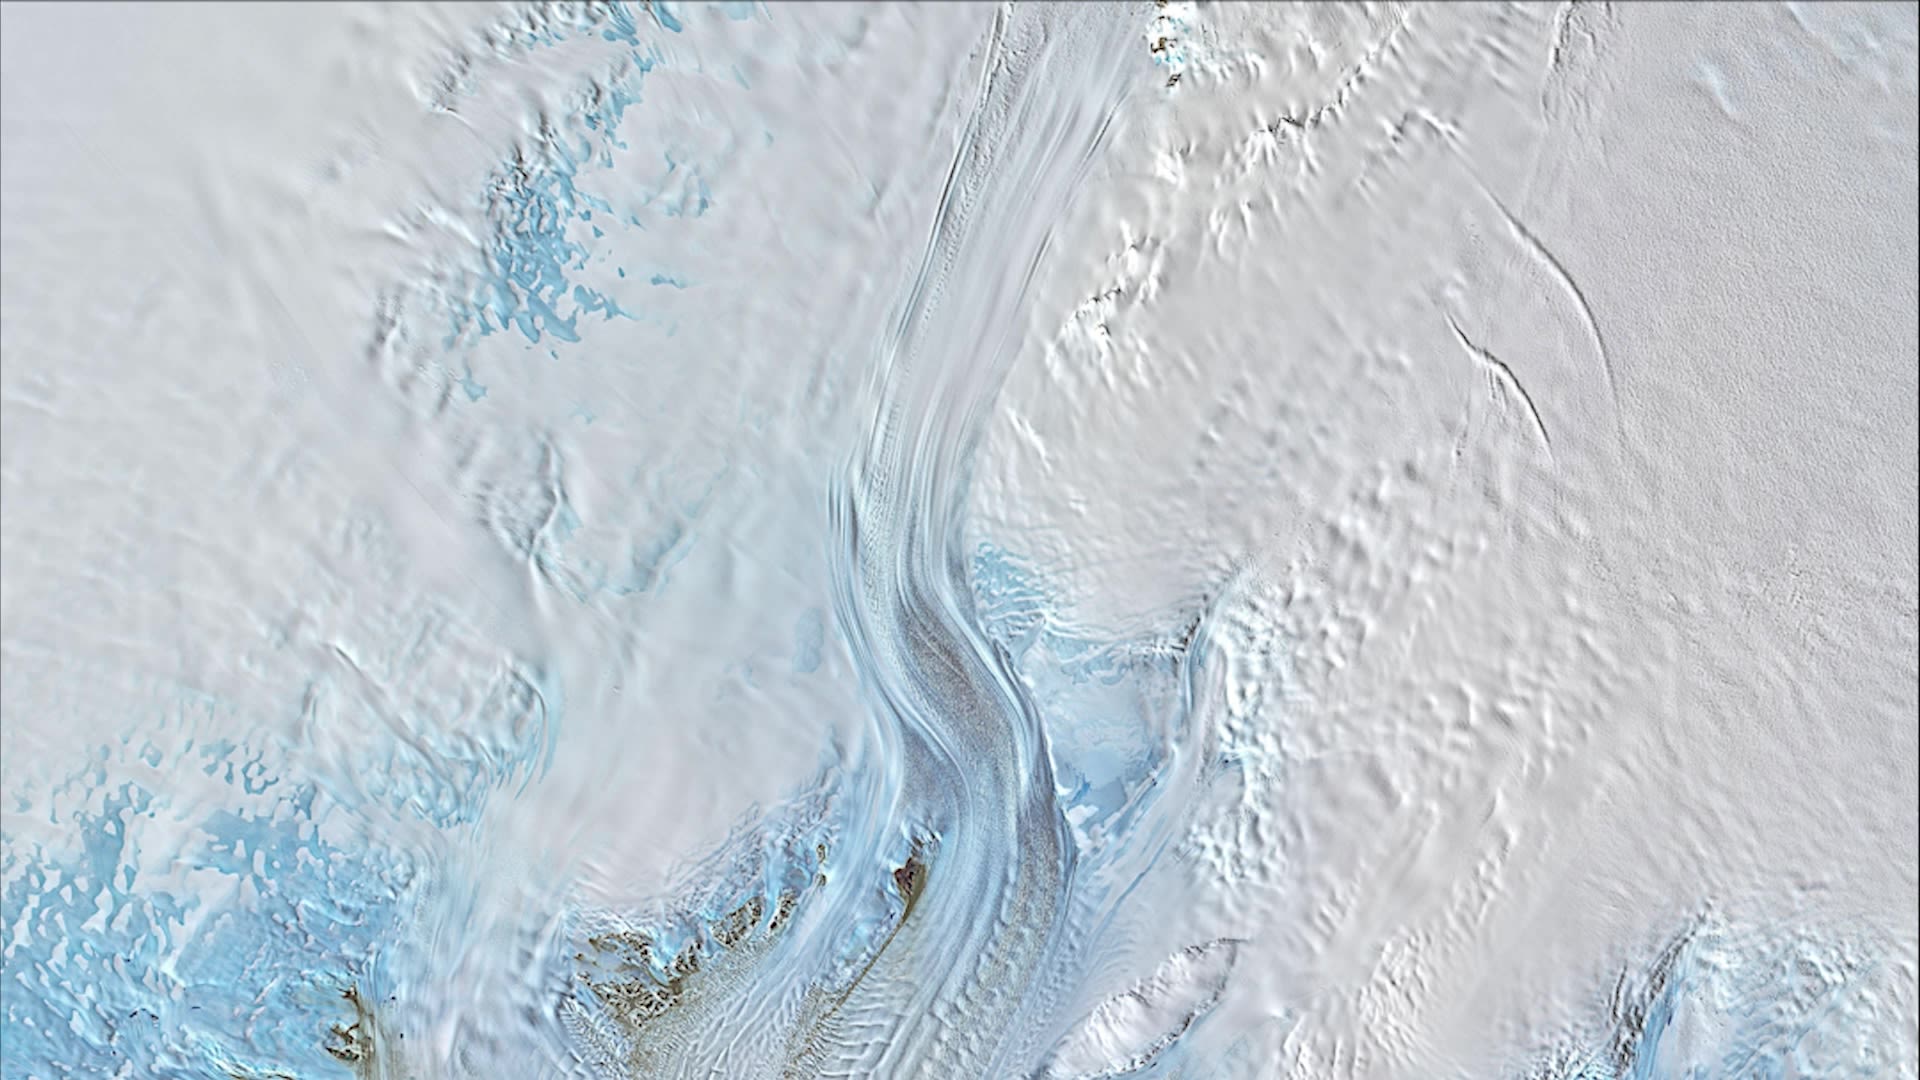
A science briefing about Antarctica
and sea-level rise
Sea-level rise is one of the most critical impacts the world faces from global warming.
Ultimately it will transform coastlines and engulf low-lying megacities and small island nations, reshaping the natural world and human society.
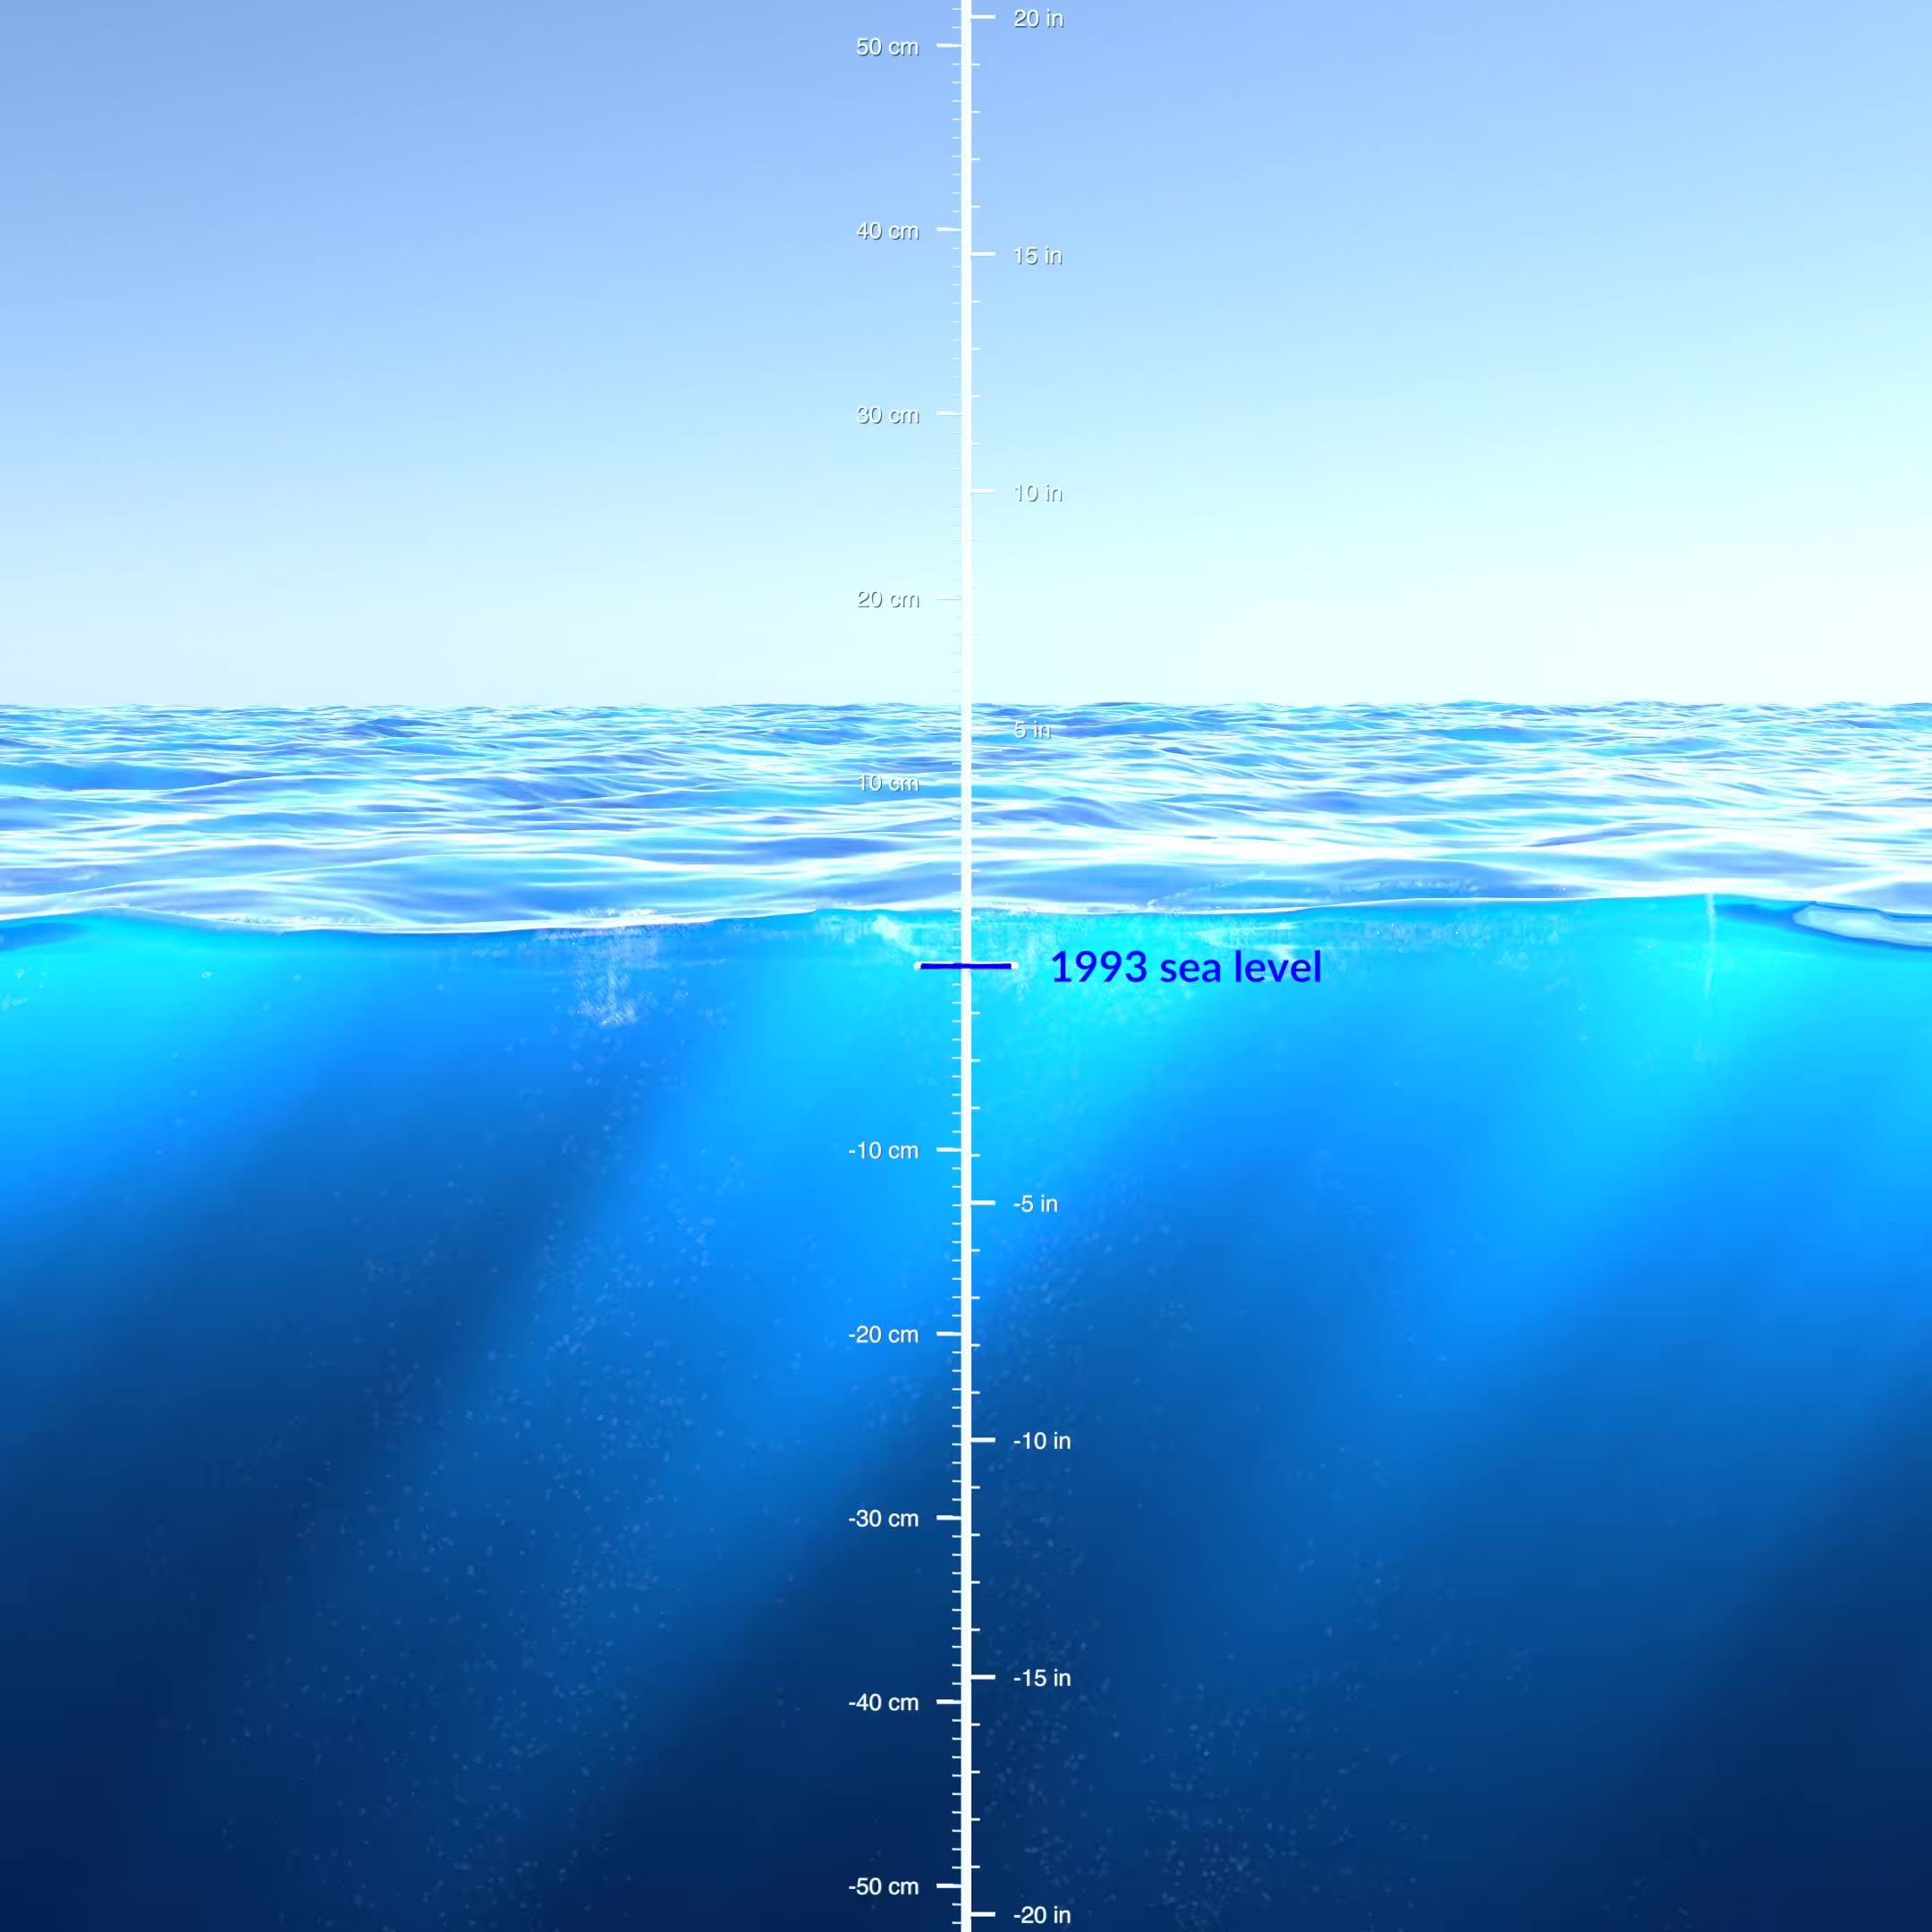
In just the last thirty years, global sea level has risen by up to 10.5 centimetres.1 That may not sound like much, but just a few extra centimetres dramatically increases the frequency of coastal flooding.2
As high emissions continue, global mean sea-level rise could top one metre by the end of this century 3 — waist-high for many people.
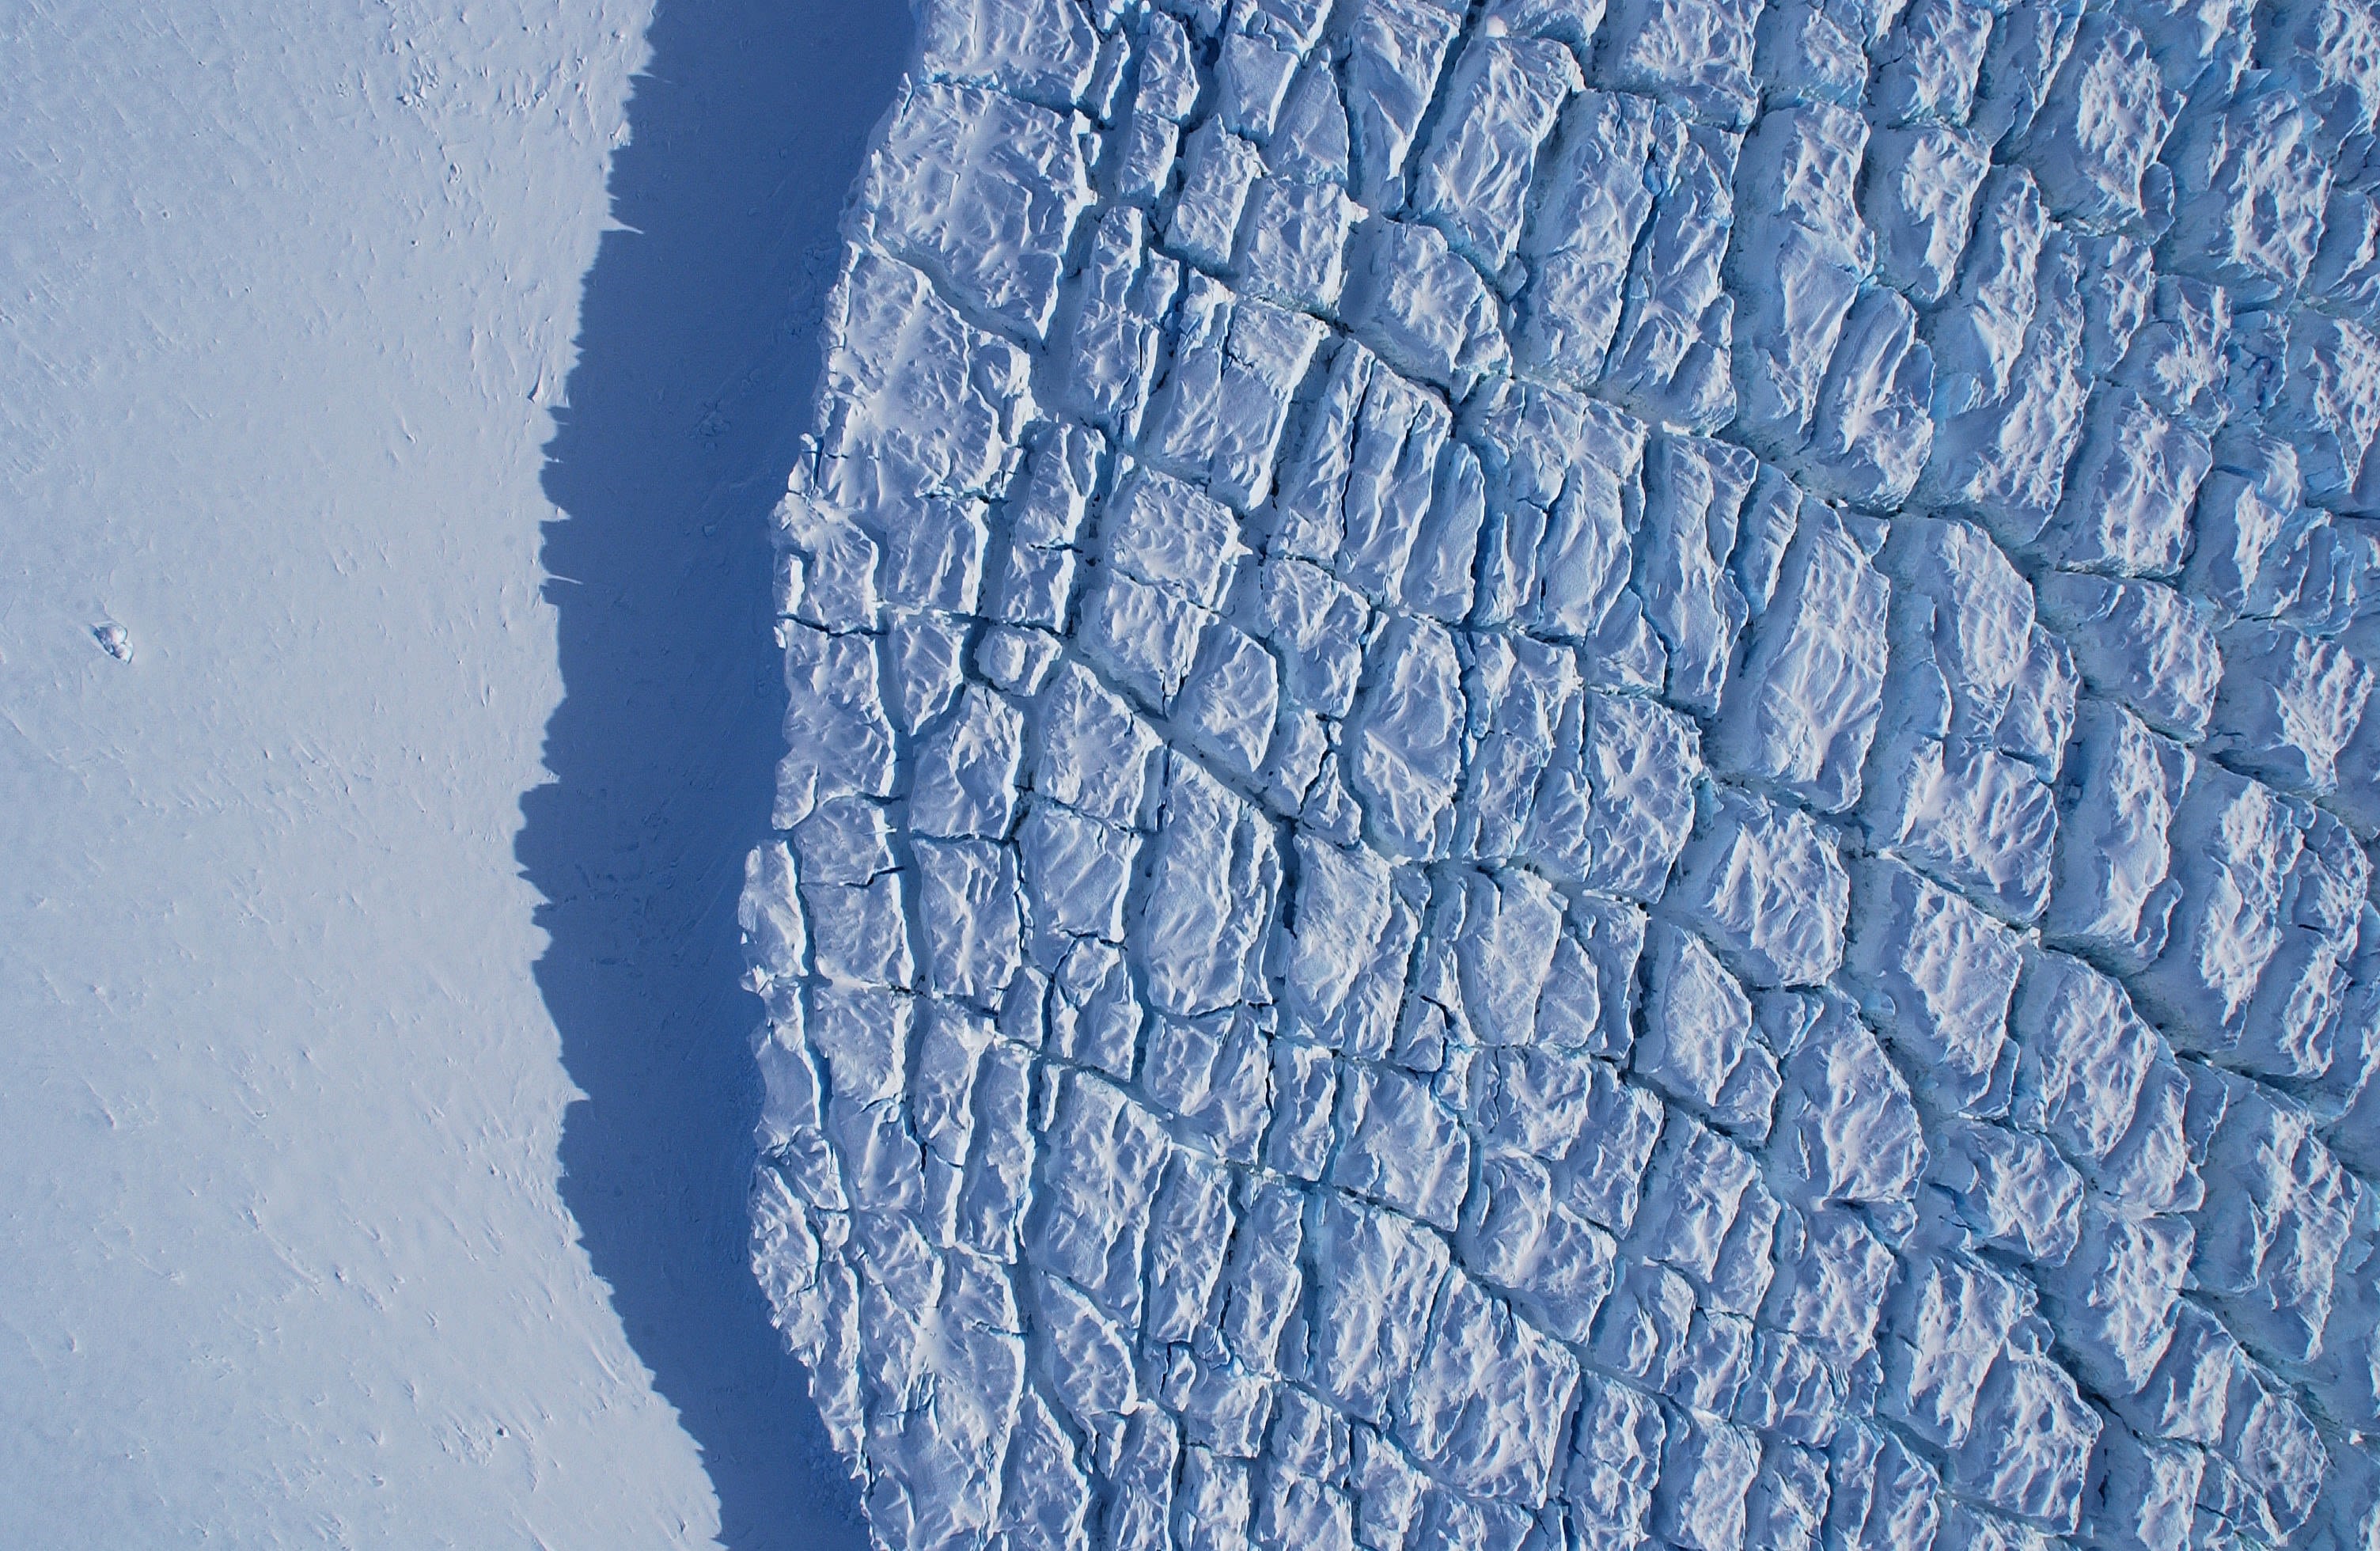
Melting ice from Antarctica is a growing contributor. Antarctica currently loses around 17 million tonnes of ice — equivalent to a giant ice cube measuring 260 metres each side — every hour.
Sea-level rise is unavoidable.
The seas are rising and will continue to rise.
We have the power to choose how far and how fast.
Why are seas rising?
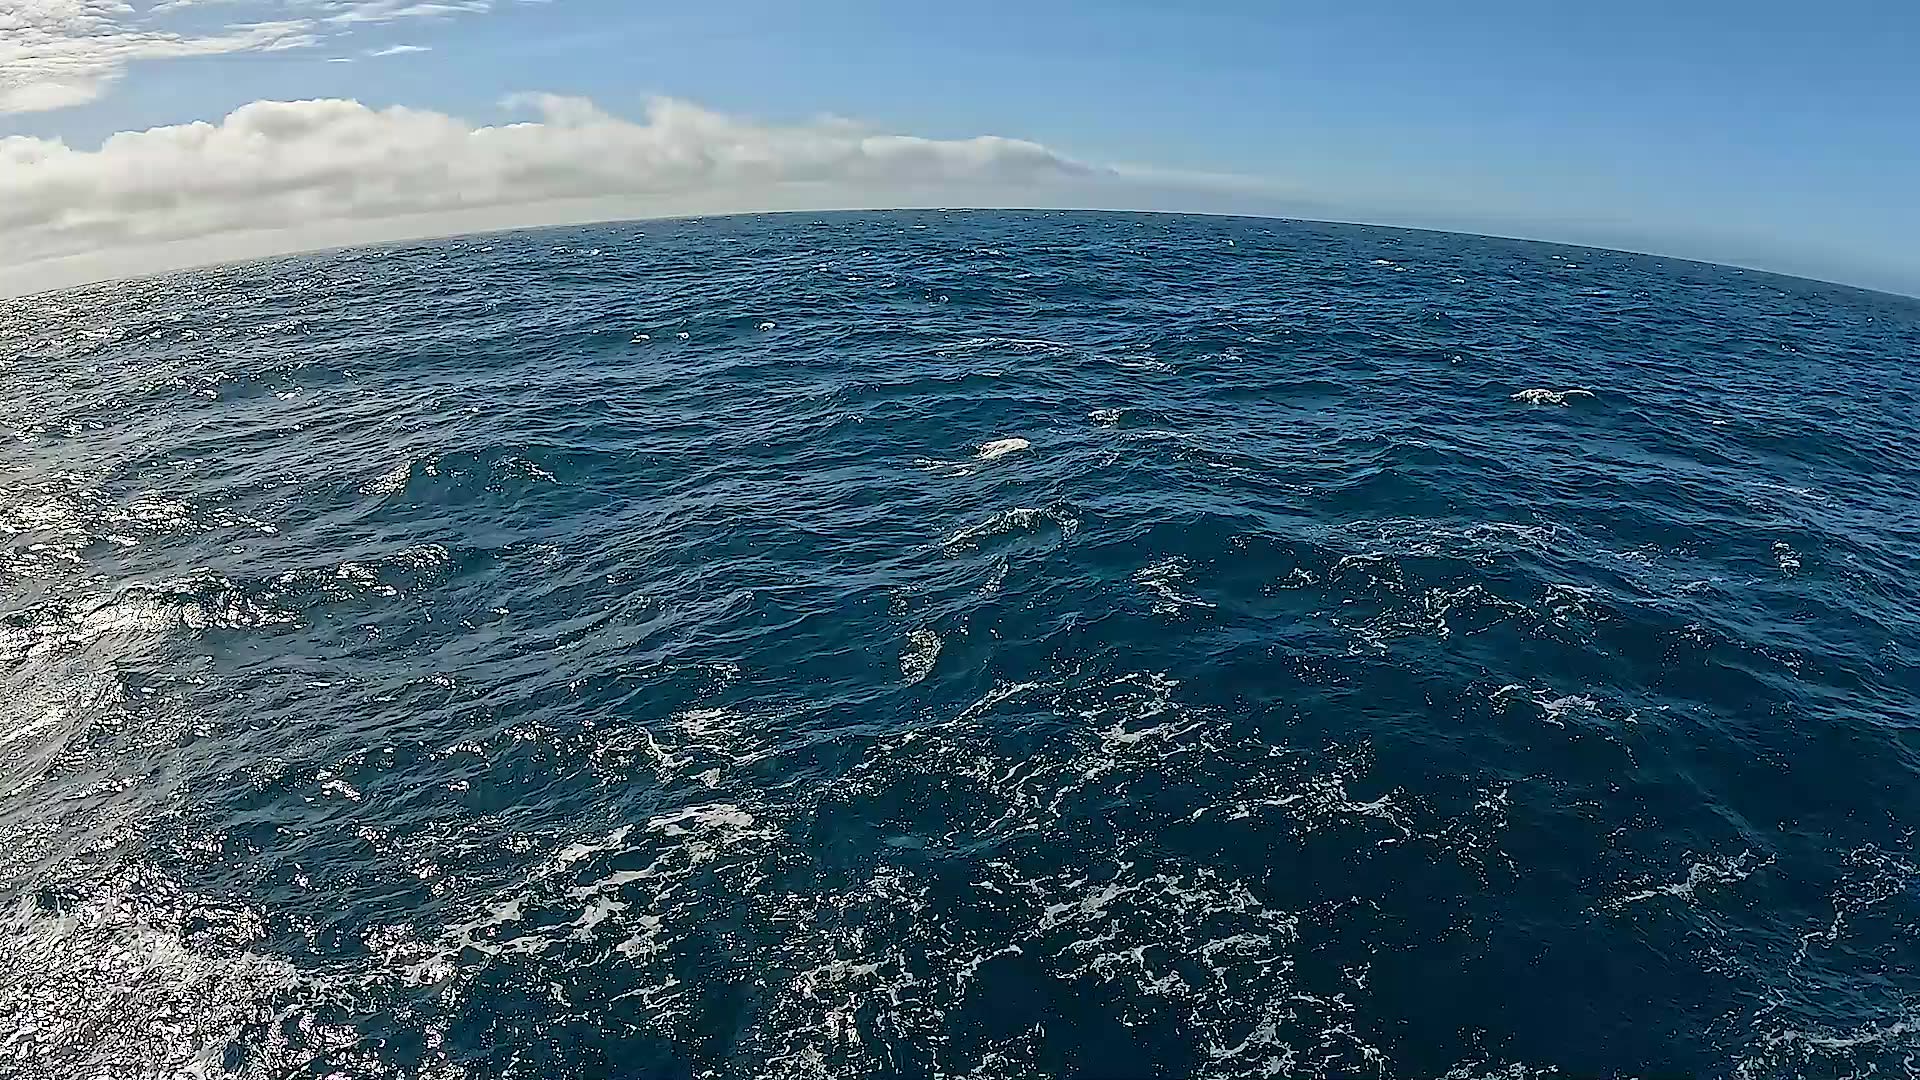
Global warming is really ocean warming. The world’s oceans have absorbed about ninety percent of human-caused excess heat. Water expands and takes up more space as it warms. Today, the ‘thermal expansion’ of oceans as they heat up is responsible for about half of global sea-level rise.
Slightly less than half comes from melting land ice in the Greenland Ice Sheet, the Antarctic Ice Sheet and mountain glaciers around the world.4 While thermal expansion and the melting of mountain glaciers have made large and sustained contributions for decades, over the last 20 years they have been equalled by melting of the ice sheets.
Greenland is currently adding more to sea-level rise than the Antarctic Ice Sheet. However, Antarctica could become the major contributor by the end of this century.5 The warming ocean will drive much of Antarctica’s melt.
Why is Antarctica important?
The Antarctic Ice Sheet covering the continent has formed over hundreds of thousands of years through the gradual buildup of snow.
Its average thickness is more than two kilometres. The ice is highest at the centre and flows slowly as glaciers towards the coast.
As this land ice doesn’t come from the sea, it adds to sea-level rise when it slides into the ocean.
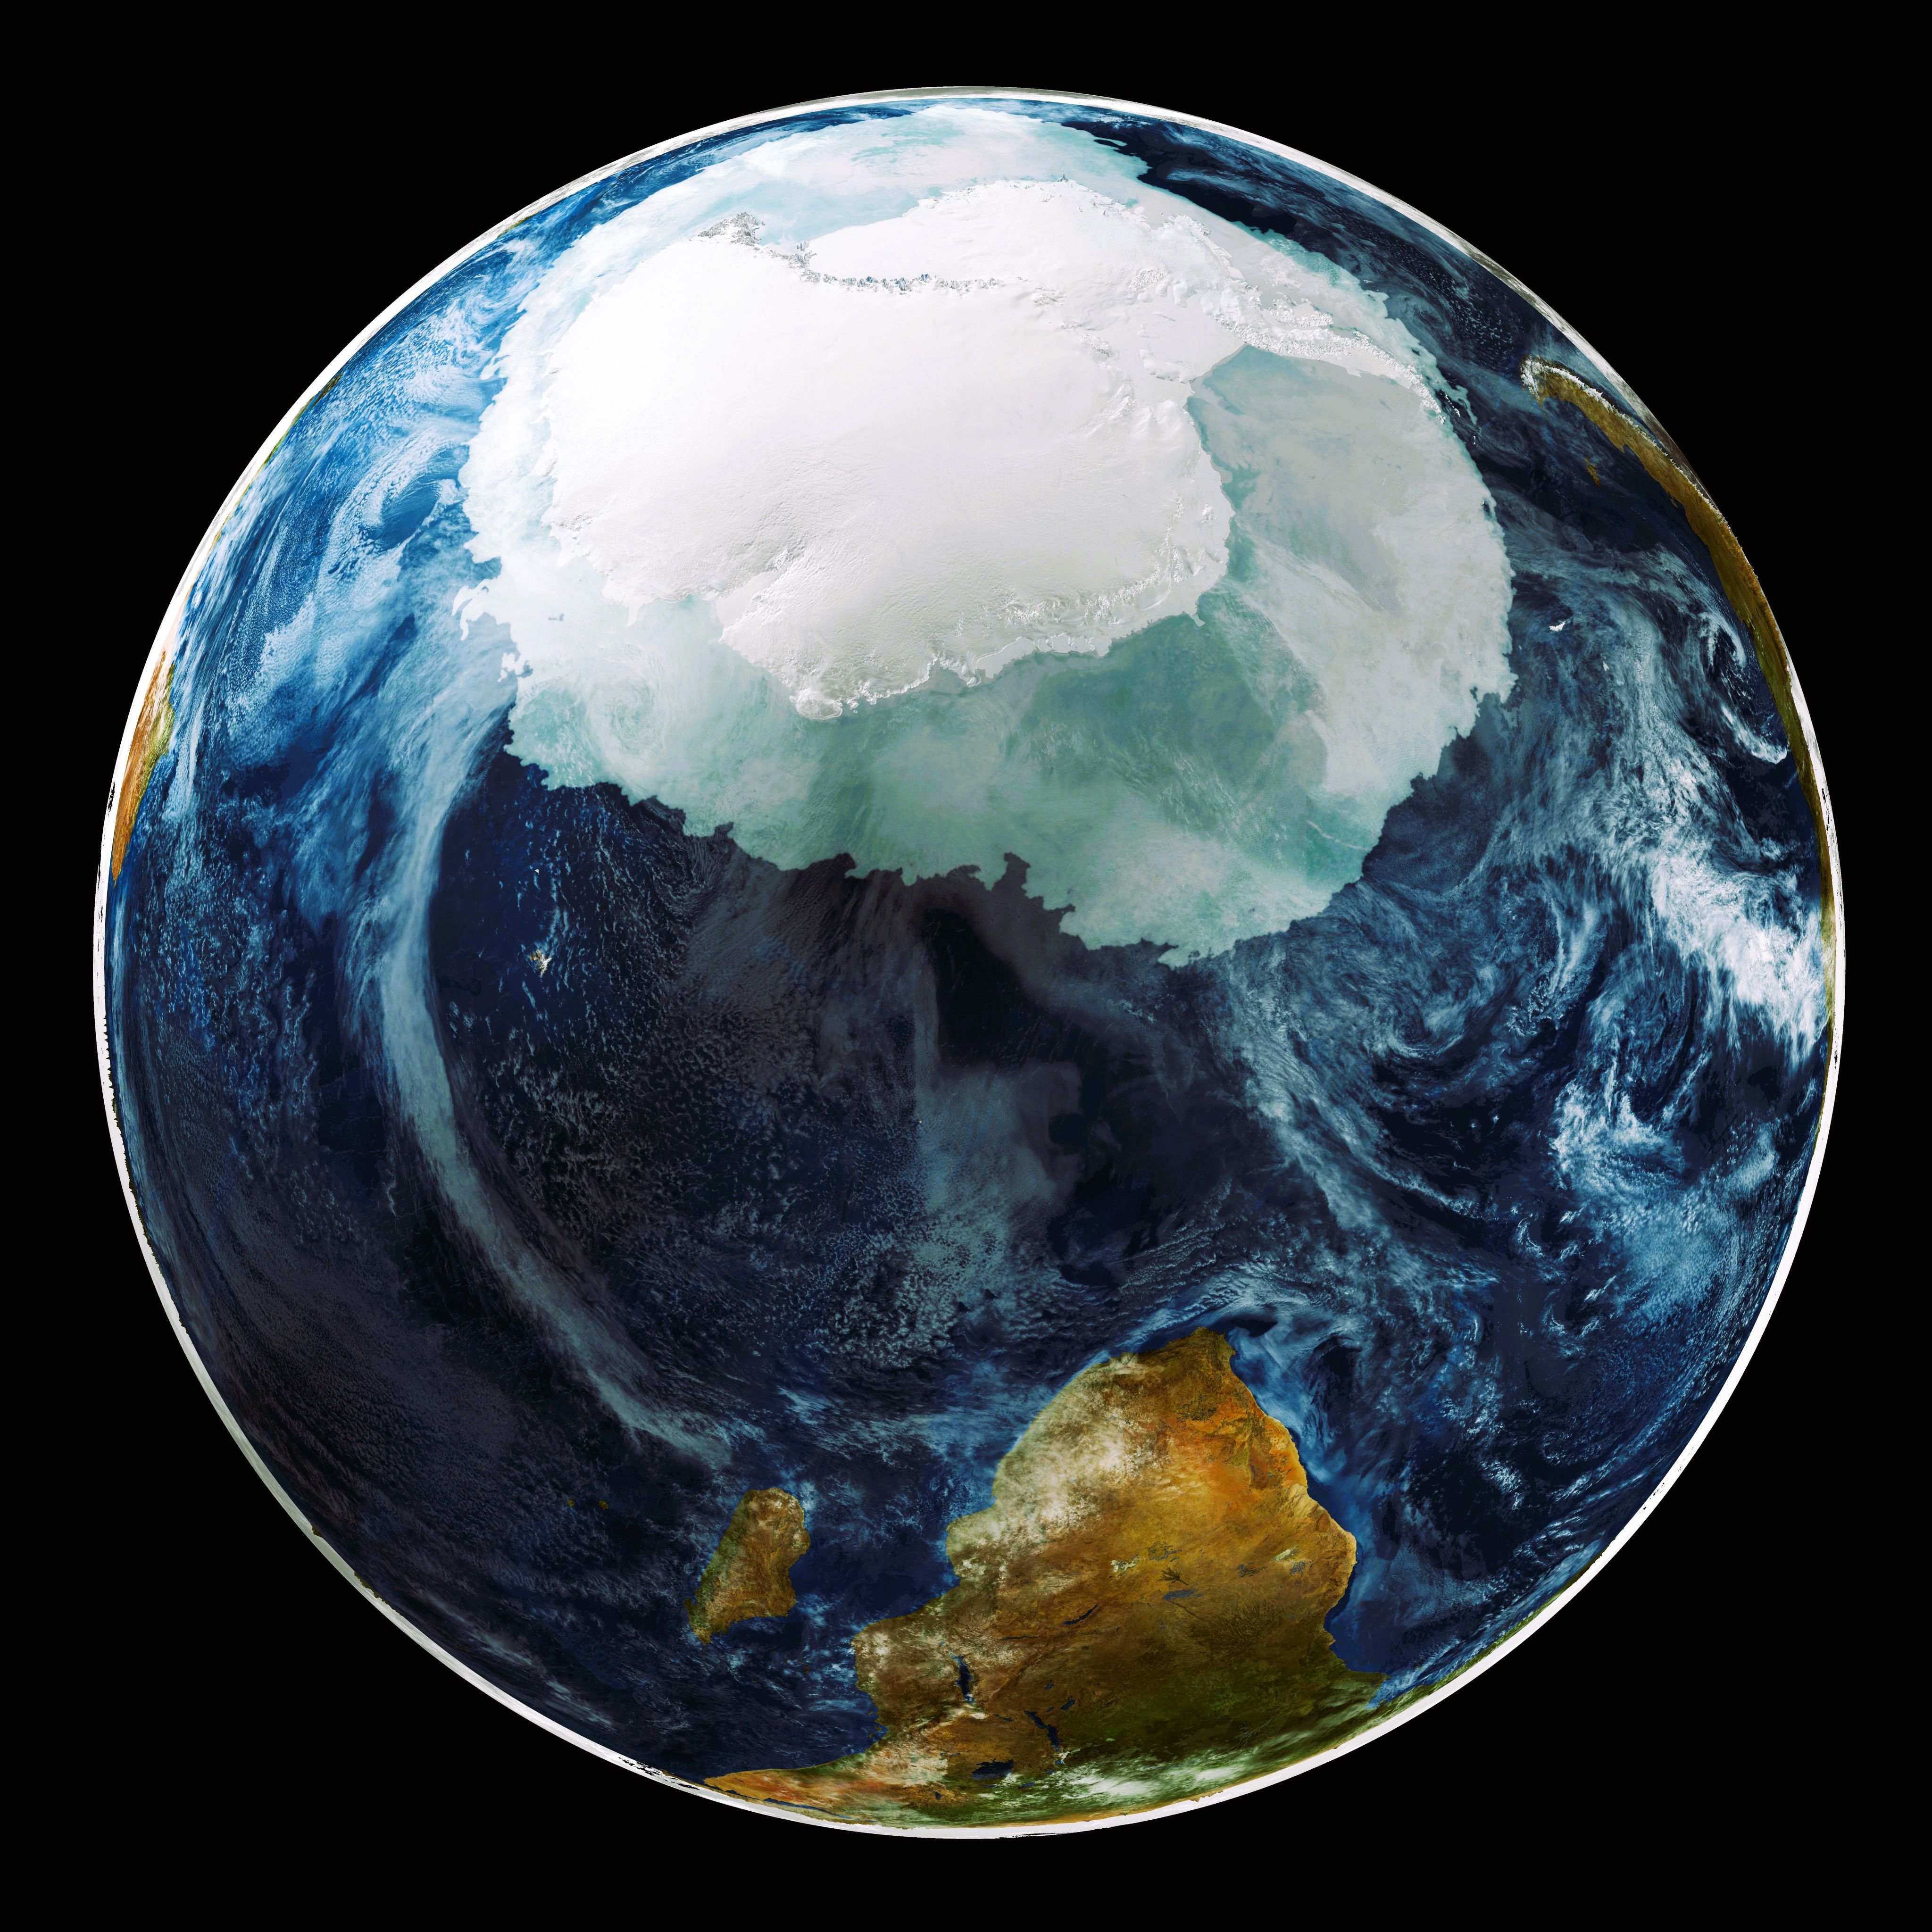
Antarctica holds the Earth’s largest body of ice, containing about 62% of the world’s total freshwater.6 This massive frozen ‘water tank’ makes the Antarctic Ice Sheet the largest potential source for global sea-level rise, holding the equivalent of 58 metres if completely melted.7
The Antarctic Ice Sheet contributes to sea-level rise when the amounts of melted and solid ice discharged into the ocean are greater than the quantity of ice gained from snowfall.
(Sea ice is frozen ocean – the annual cycle of freezing and thawing doesn’t directly contribute to sea-level rise as it’s already floating.)
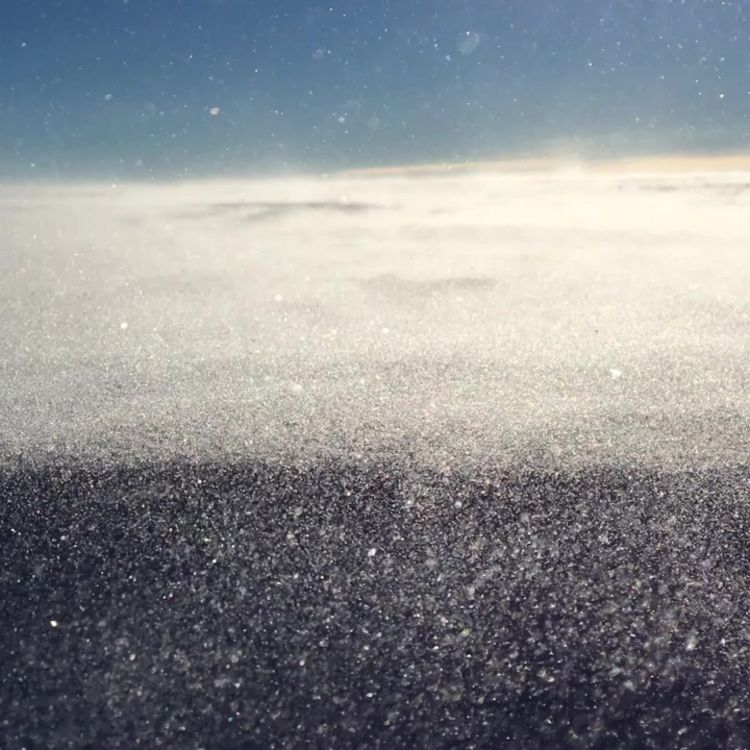
Antarctic ice mass loss 2002-2023 (NASA)
Antarctic ice mass loss 2002-2023 (NASA)
Back in the 1990s, reports from the Intergovernmental Panel on Climate Change (IPCC) concluded that ice sheets changed too slowly to be of concern. It was known they waxed and waned between ice ages, shifting sea levels by hundreds of metres, but this had happened over tens of thousands of years.
But since then, satellite measurements show that ice loss in Antarctica is accelerating, and today is more than six times faster than 30 years ago.8 So far, most loss has come from West Antarctica, where warm ocean waters are melting the ice sheet.
The largest part of the icy continent, East Antarctica, was once thought to be isolated from and immune to rapid warming. However, satellite data show increased ice losses in some areas since the early 2000s.9 This is a deep concern as the East Antarctic Ice Sheet contains the vast majority of Earth’s glacier ice,10 over four times more than both Greenland and West Antarctica combined.
How does Antarctica lose ice?
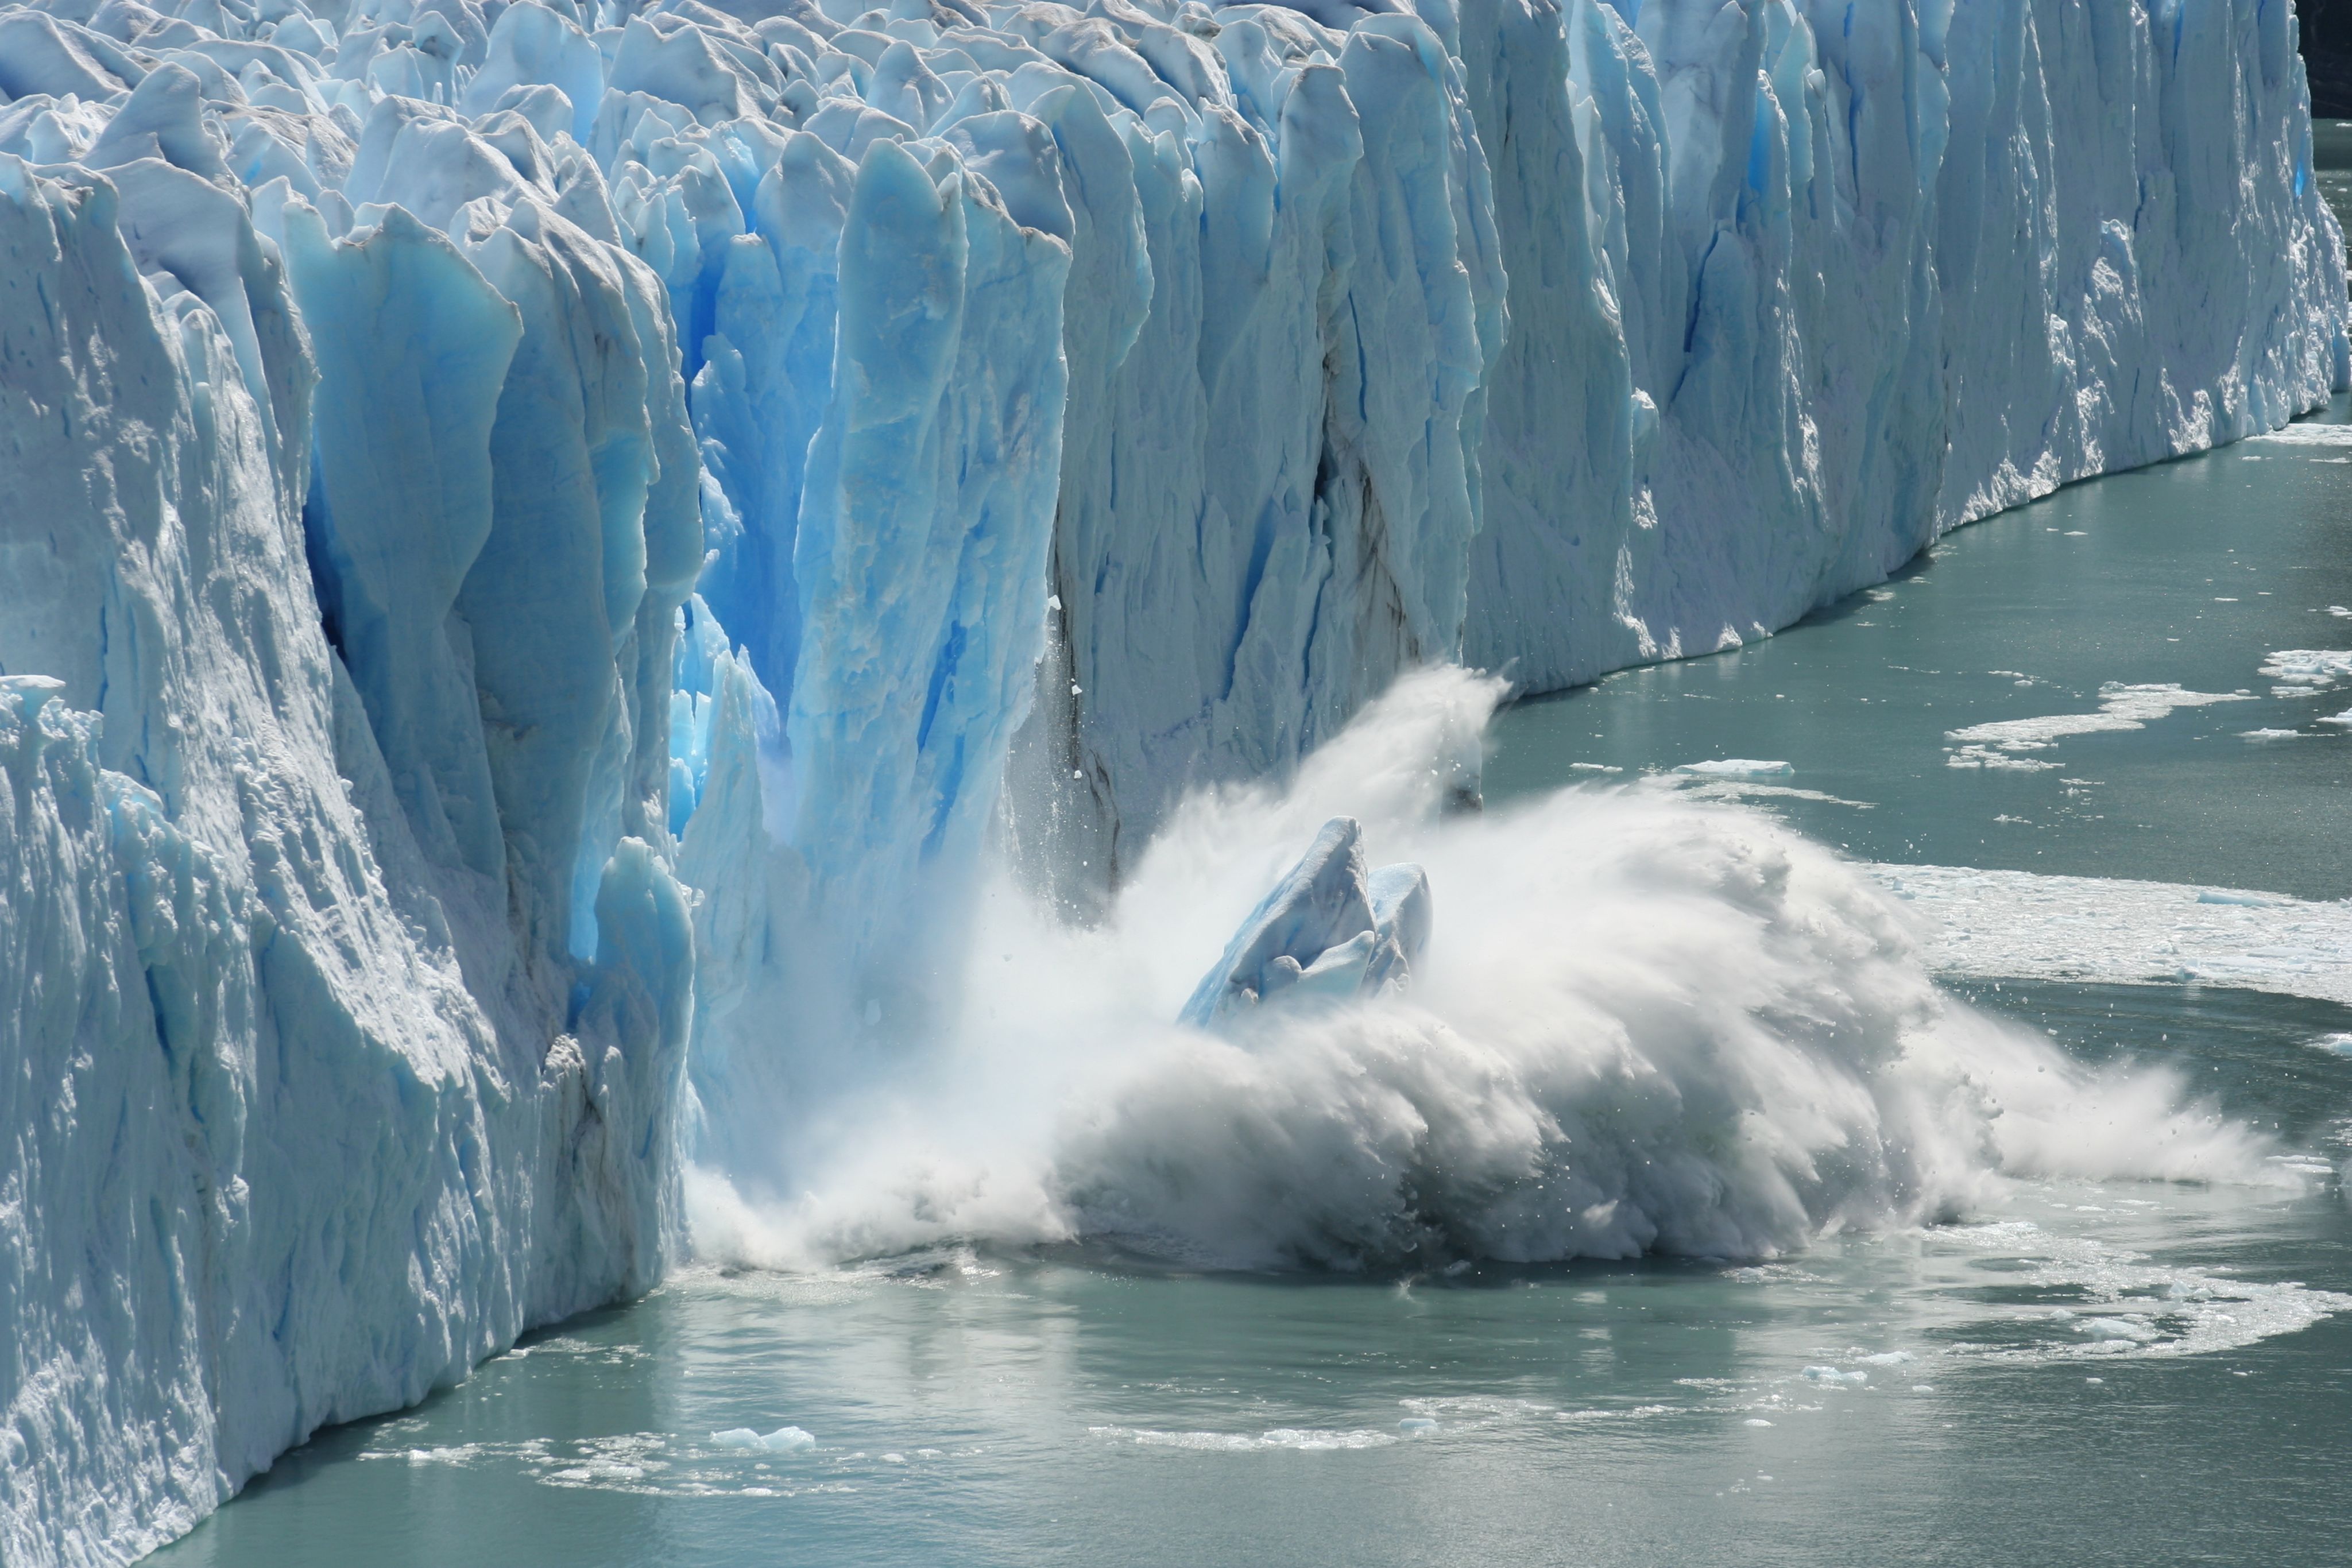
Antarctica’s coastal fringe is its key point of vulnerability. This is where the floating extensions of the glacial land ice, known as ice shelves, buttress the ice sheet on land.
They fringe three-quarters of the Antarctic coast. Like ‘dam walls’, they restrain land ice from flowing into the sea and causing sea-level rise. Without ice shelves to brace them, glaciers could slide into rapid retreat.
When warmer waters get underneath, the ice shelves melt, become thinner and perhaps disintegrate faster, allowing land ice to move faster into the ocean.
The Southern Ocean surrounding Antarctica controls the fate of the Earth’s largest ice sheet. Over the past two decades, the Southern Ocean has seen the largest increase in heat storage, with accelerated warming particularly in the upper 2000 metres of the ocean. It is now storing almost the same human-caused excess heat as the Atlantic, Pacific, and Indian Oceans combined.11
Opening the floodgates
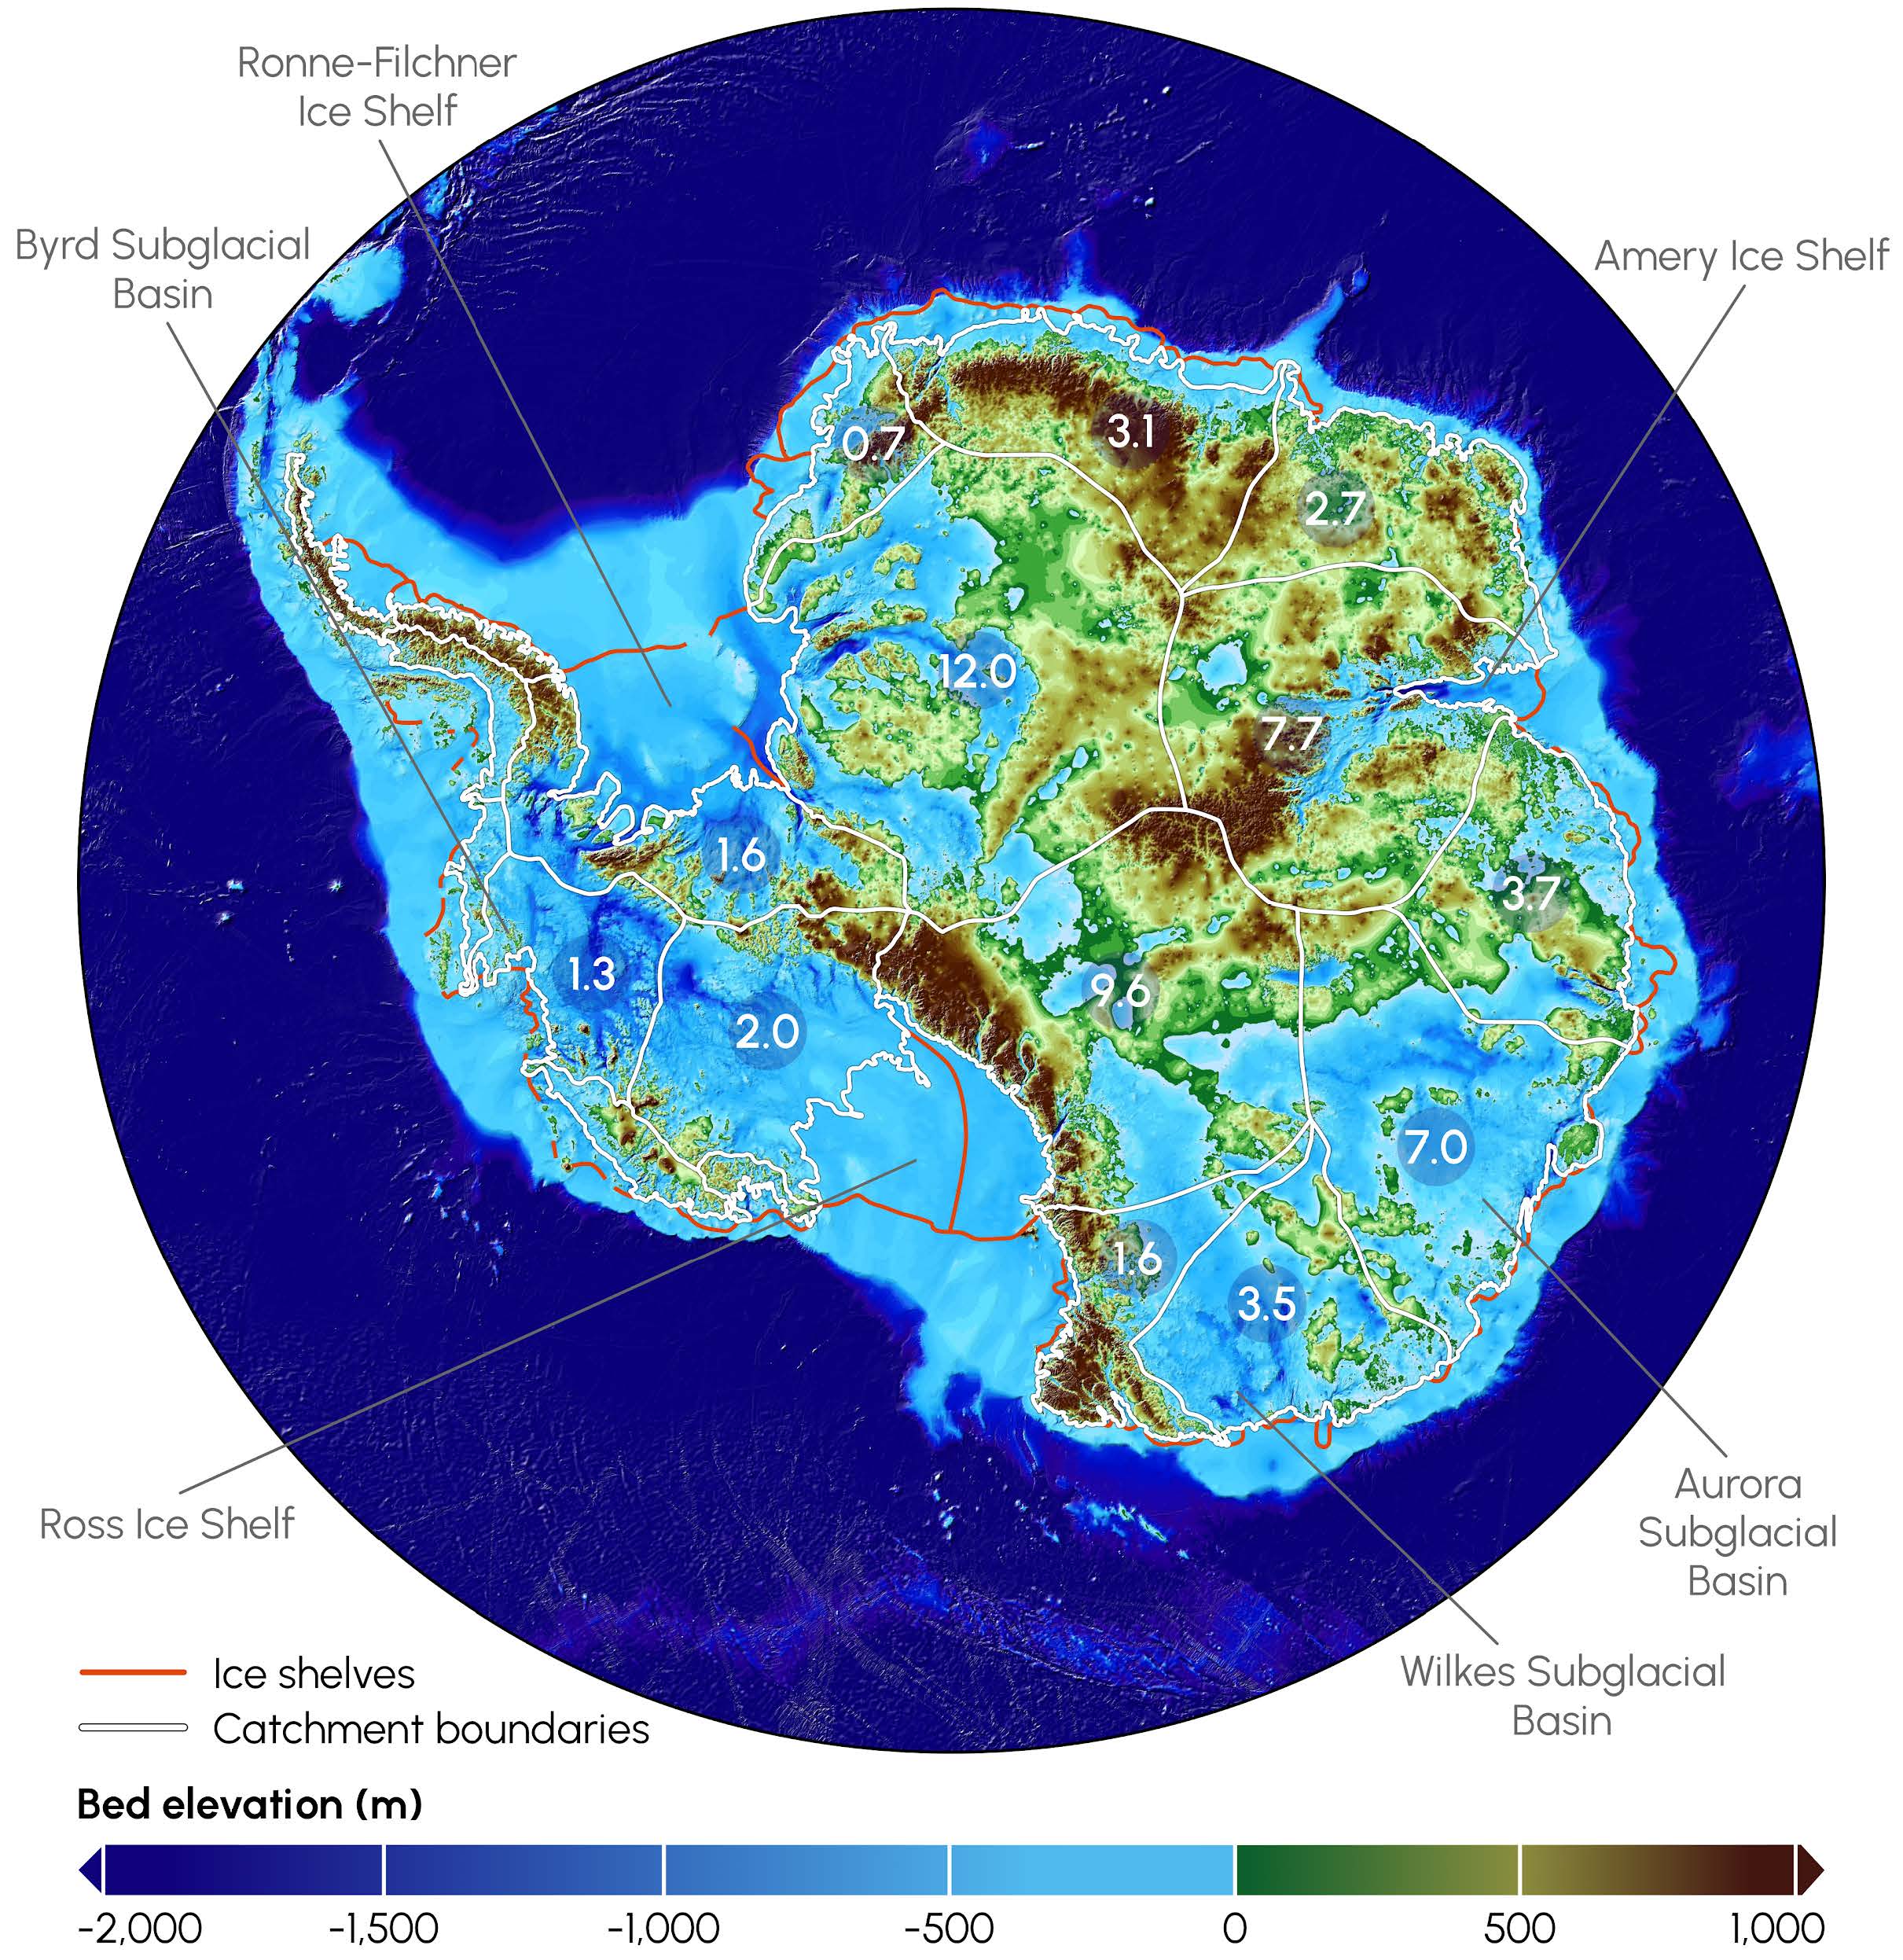
Much of the fringe of the Antarctic Ice Sheet rests on bedrock hundreds to thousands of metres below sea level.
The topography of Antarctic bedrock, overlain with ice drainage basins, ice shelves and estimated global mean sea-level potential from each basin in metres (from Galton-Fenzi et al. 2024 12 )
The topography of Antarctic bedrock, overlain with ice drainage basins, ice shelves and estimated global mean sea-level potential from each basin in metres (from Galton-Fenzi et al. 2024 12 )
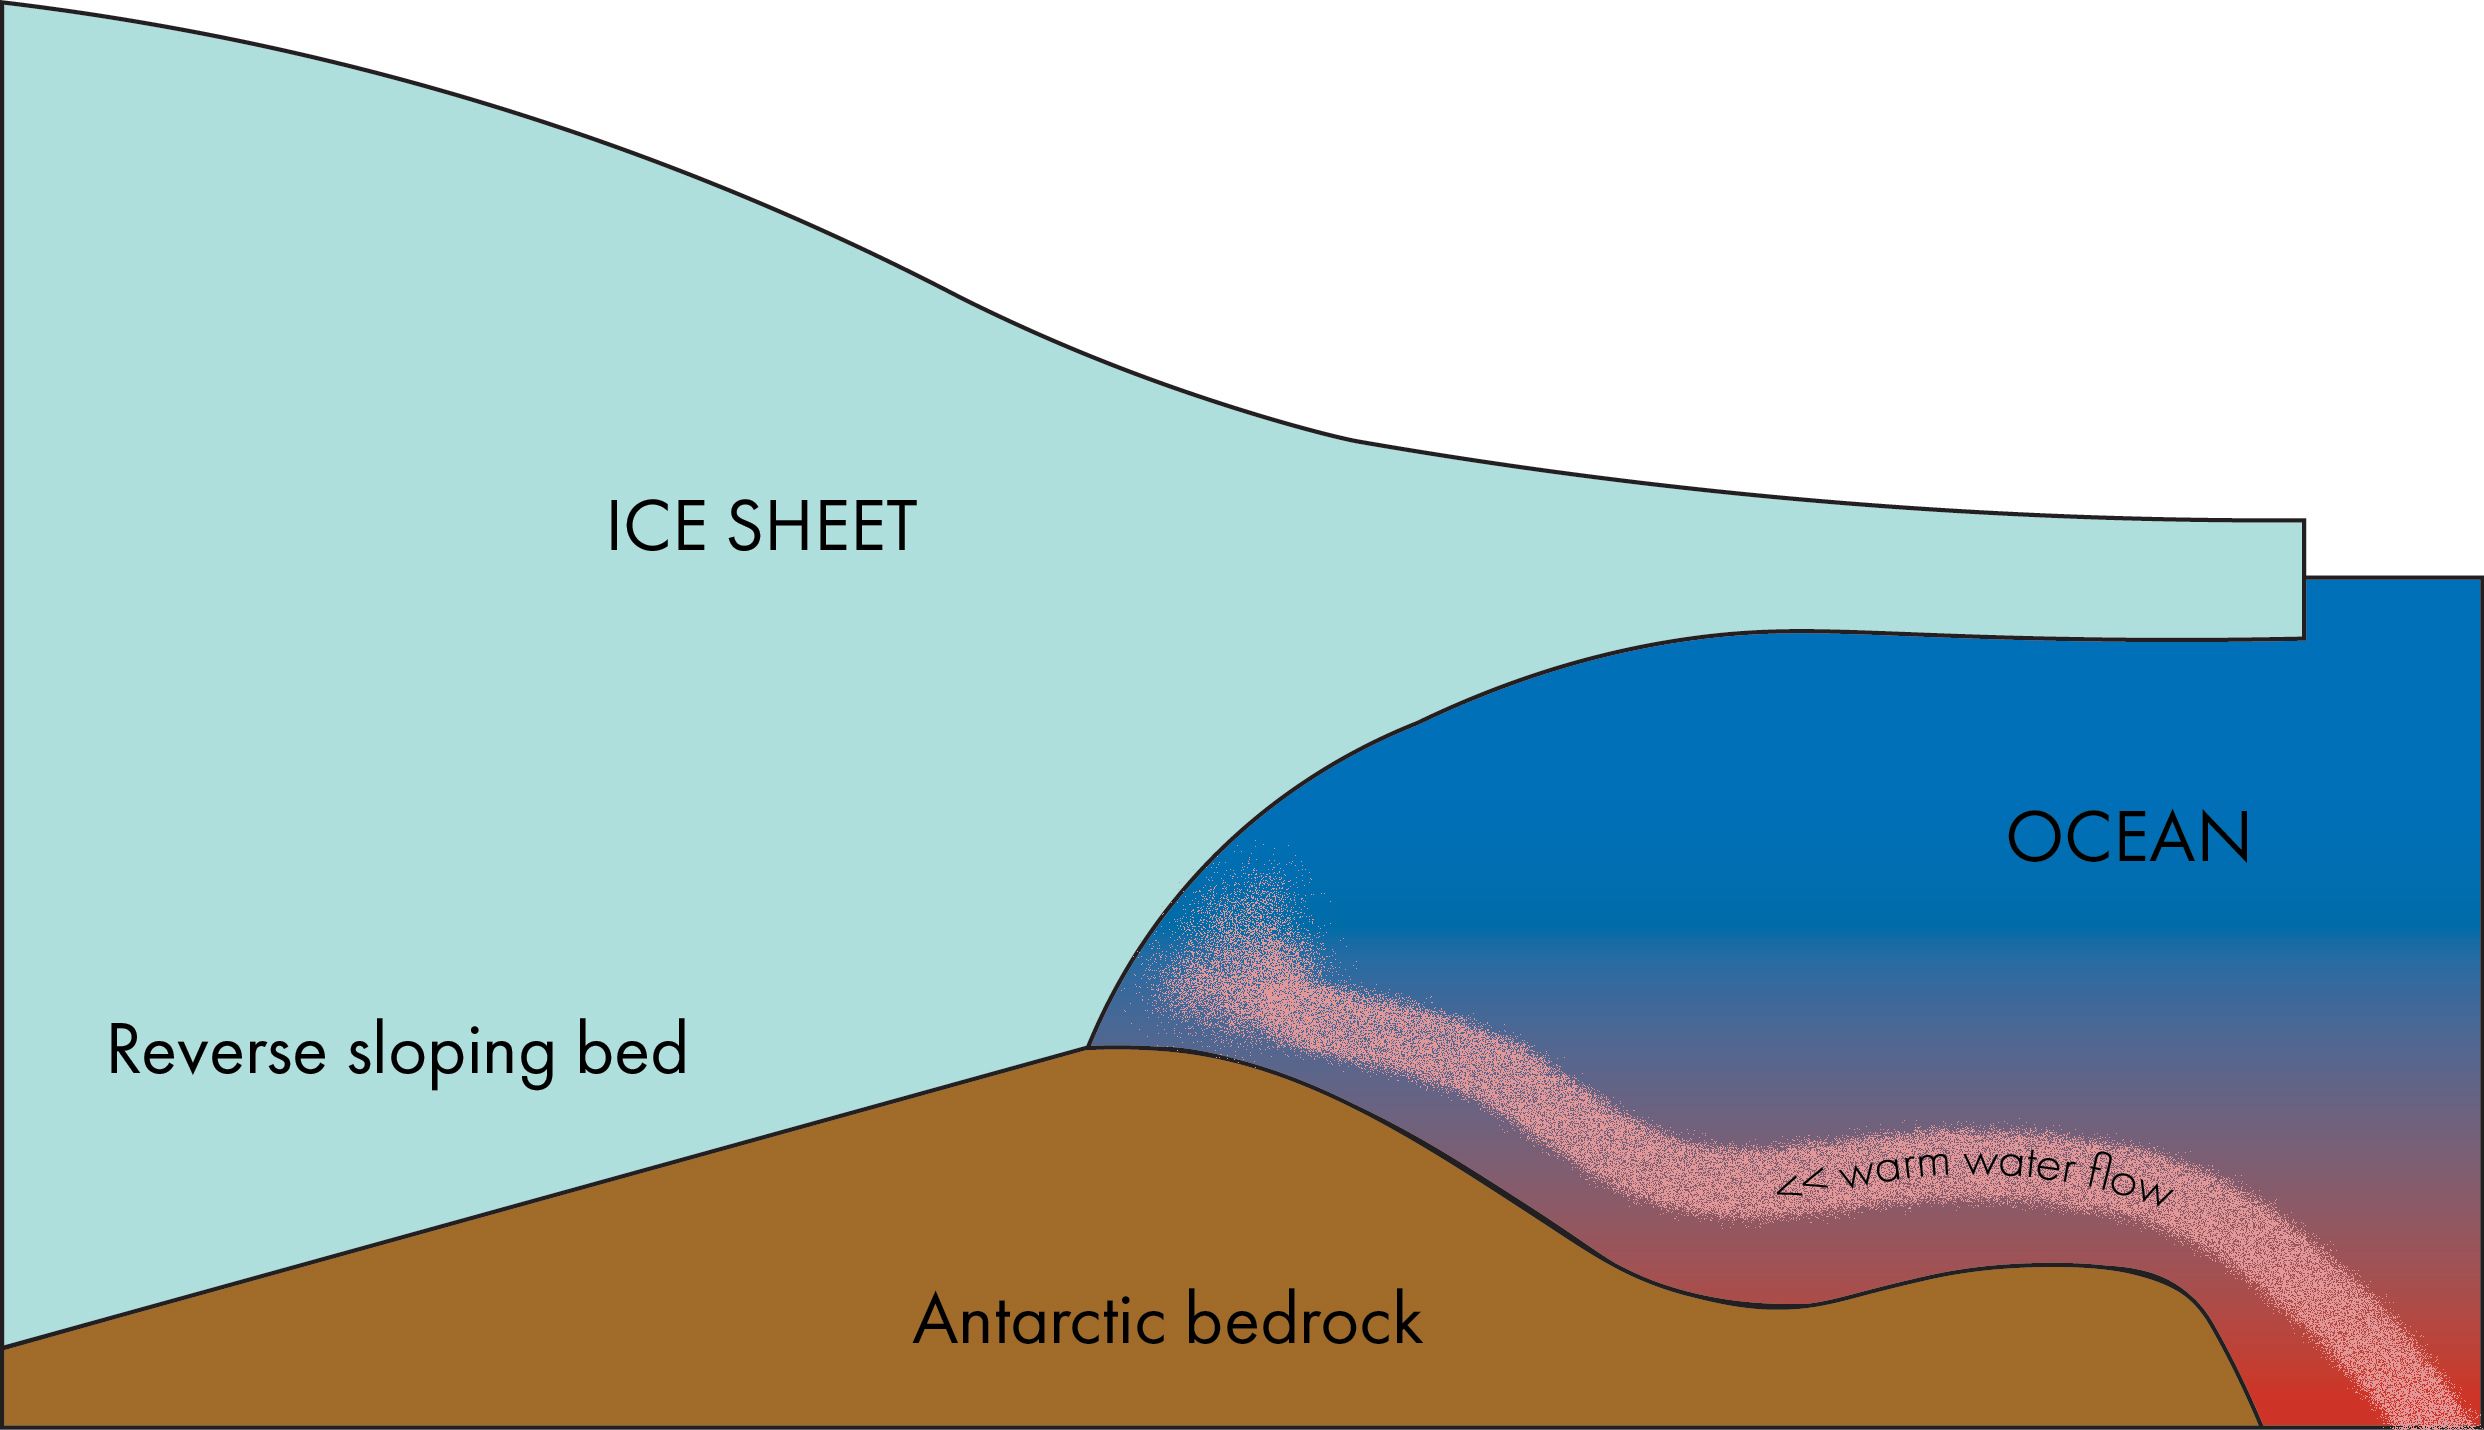
Where the bedrock slopes downwards and the interior is deeper than the coast (a ‘reverse sloping bed’), the ice sheet is inherently unstable, known as ‘marine ice sheet instability’.
With warm seawater increasingly coming in contact with the ice sheet, there could be an accelerated and potentially unstoppable ice loss on a massive scale.
Marine ice sheet instability: it's all downhill from here
Marine ice sheet instability: it's all downhill from here
usceptible to marine ice sheet instability
Only recently has it been discovered that much of the East Antarctic Ice Sheet is grounded below sea level on a reverse sloping bed and therefore susceptible to marine ice sheet instability.
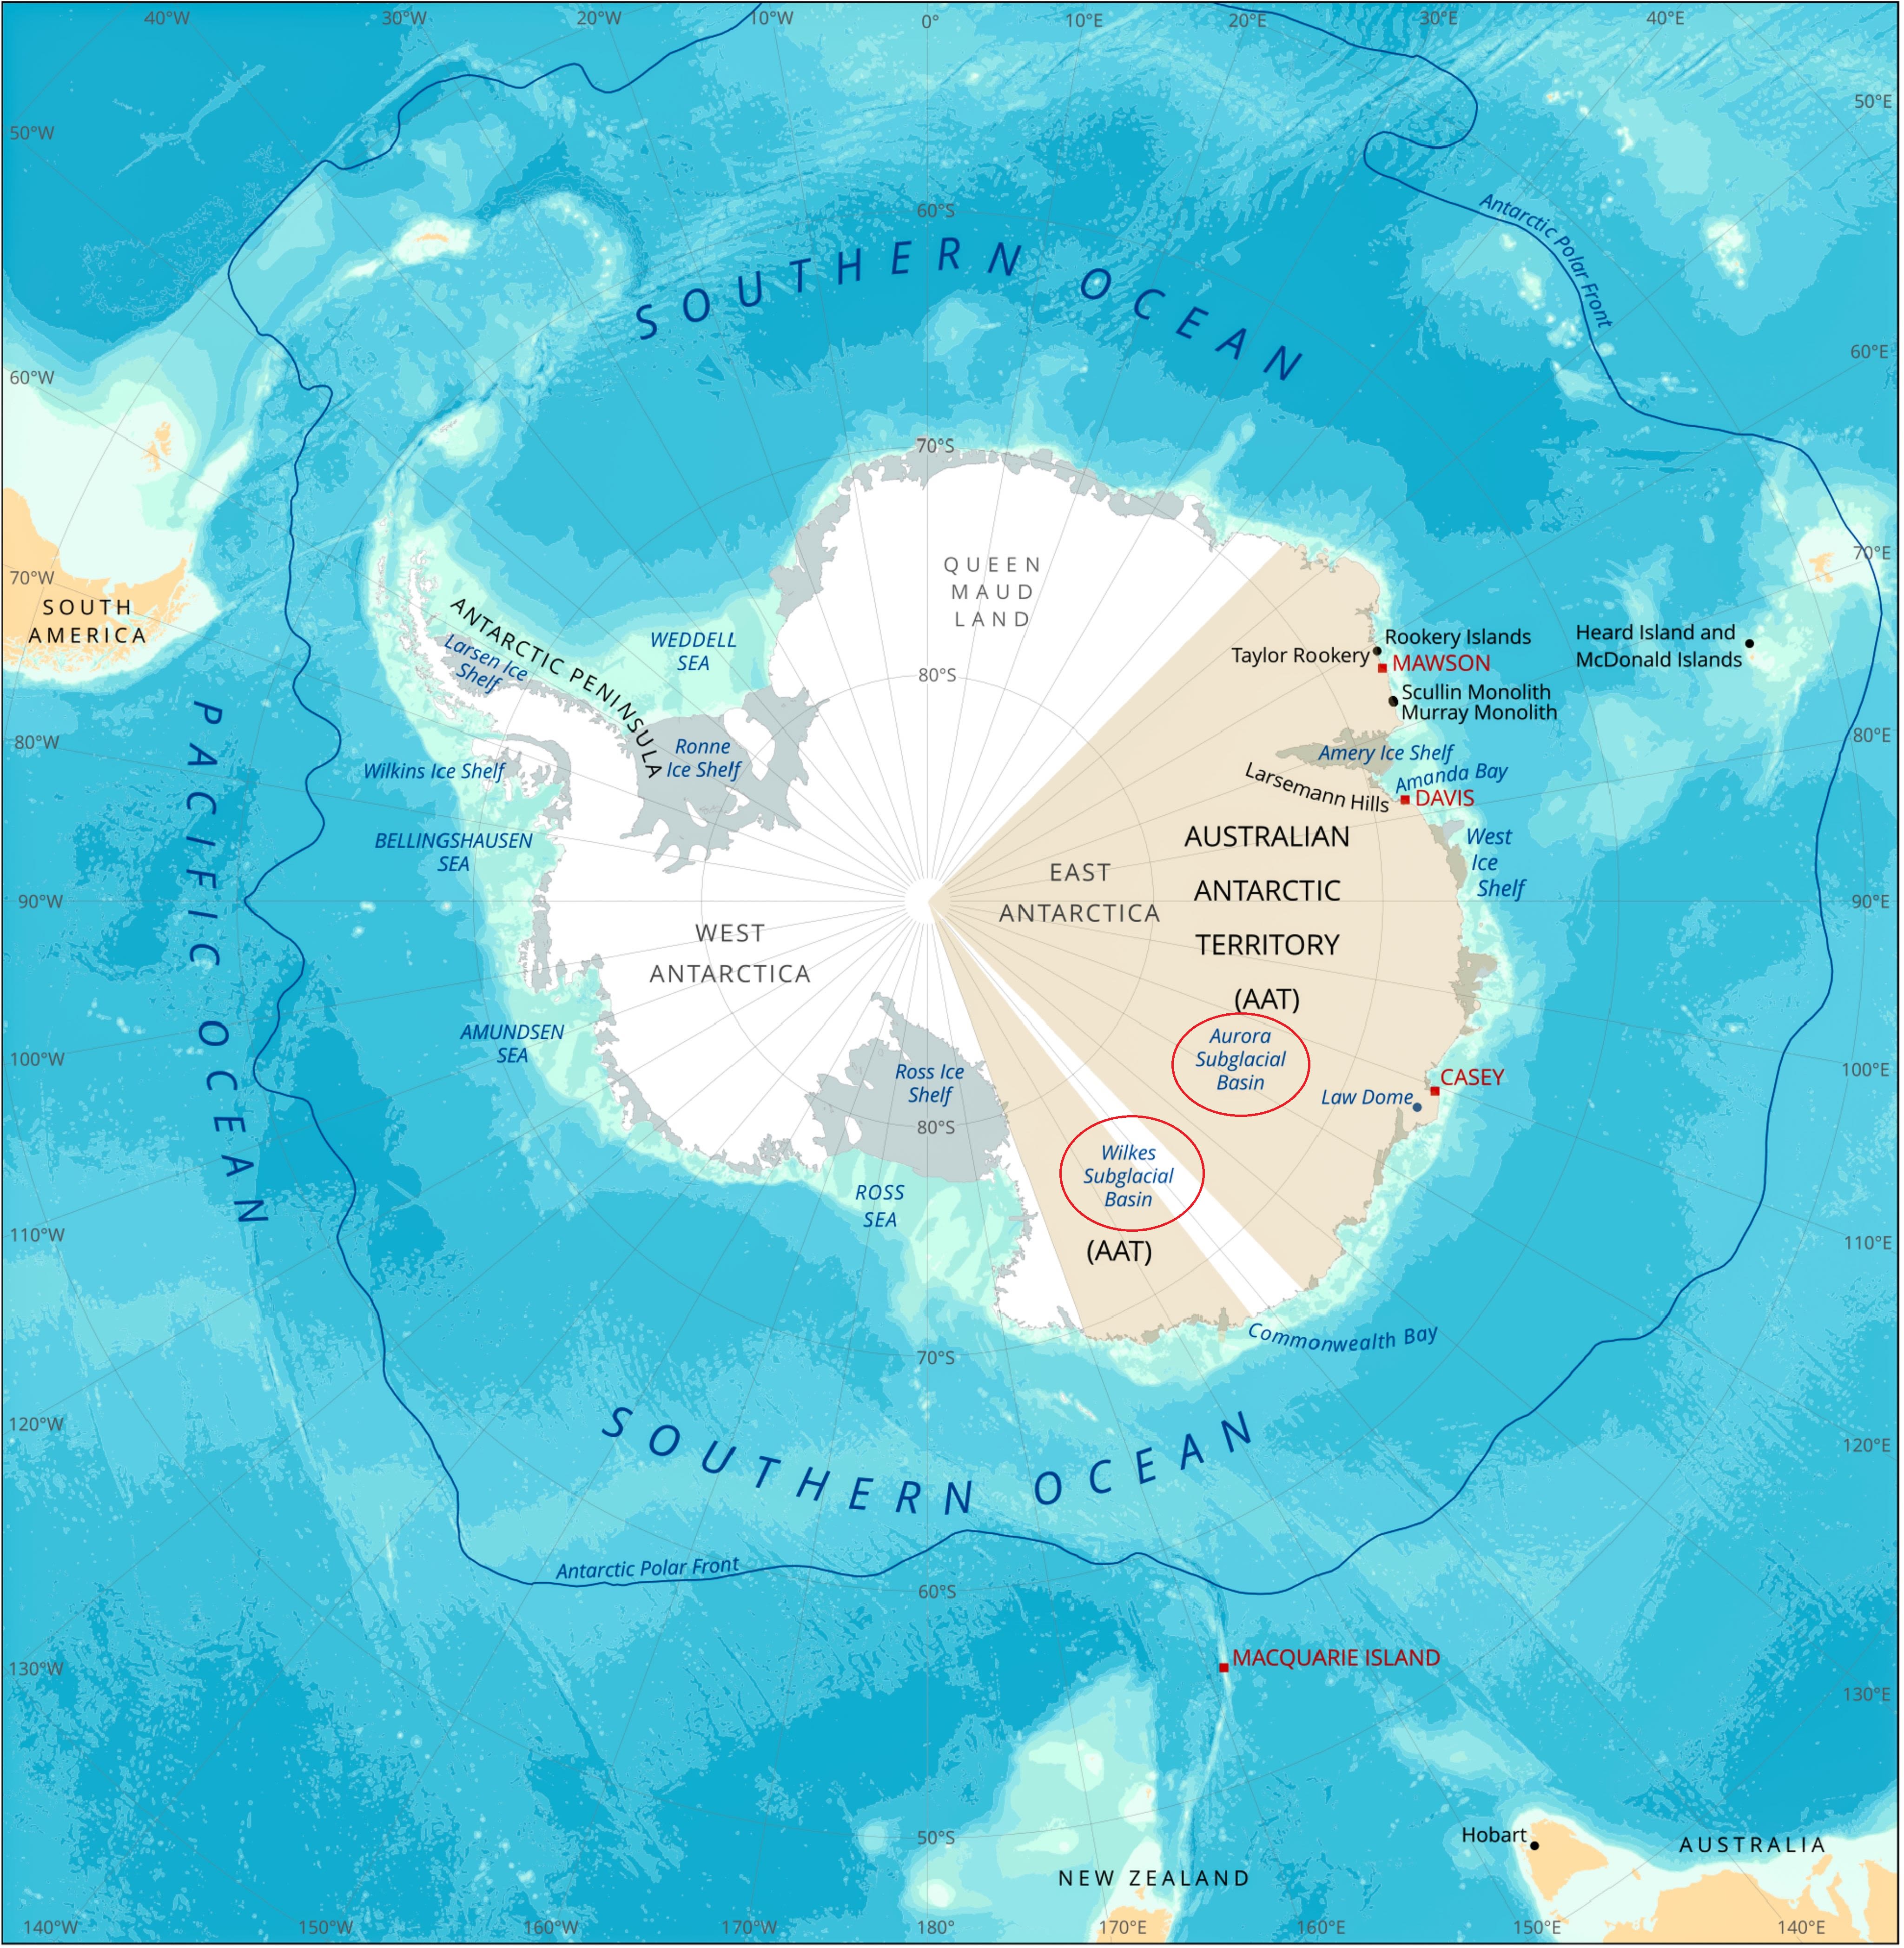
Two main such subglacial regions in Australian Antarctic Territory are the Wilkes and Aurora basins, holding more than 10 metres of potential sea-level rise. Worryingly, glaciers in these basins are changing and losing mass.
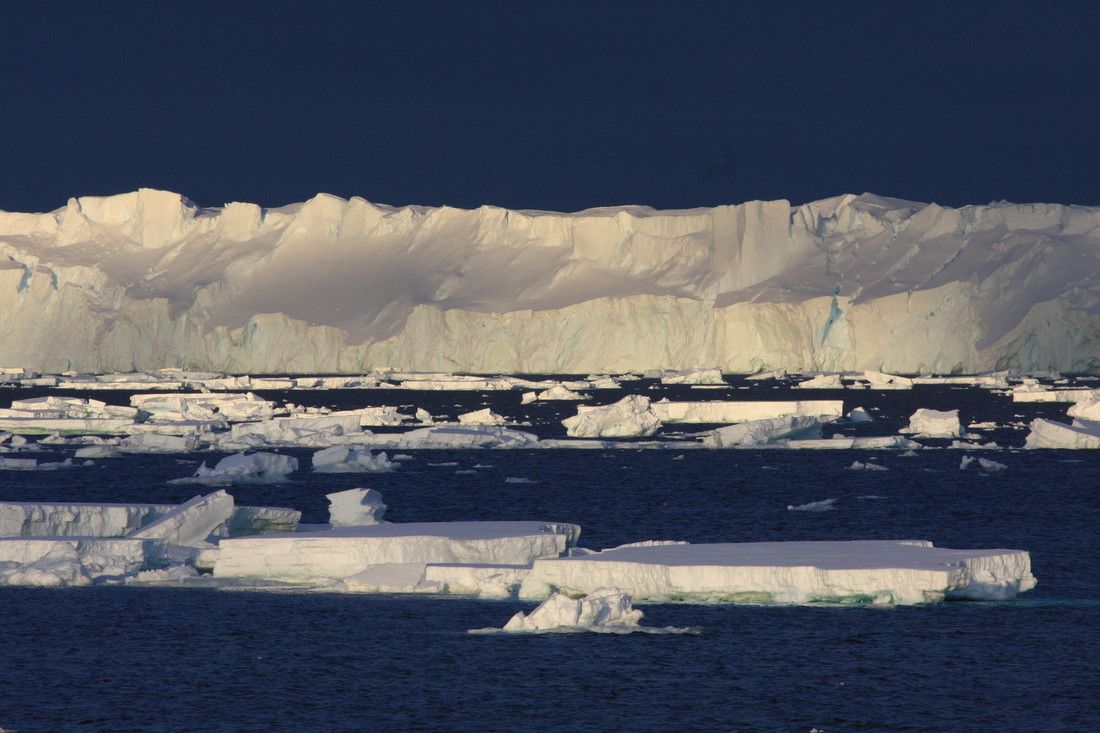
Totten Glacier ice front (Esmee van Wijk, CSIRO)
Totten Glacier ice front (Esmee van Wijk, CSIRO)
Ice sheets are vulnerable to ‘tipping points’, where rapid and irreversible change can occur. Once a tipping point is crossed, ice sheet retreat continues to accelerate even if temperatures are stabilised. Some of the most severe tipping points in the global climate system are thought to be in Antarctica.
If a tipping point has already been reached, rates of sea-level rise will likely rise above current projections. The deep uncertainties around some key ice-sheet processes mean they do not feature adequately in models. This is why the IPCC states that sea-level rise of 2 metres by 2100 or 5 metres by 2150 cannot be ruled out in high-impact scenarios tied to ice sheets.
Delivering the science
Nowhere on Earth is there a greater cause of uncertainty in sea-level rise projections than from East Antarctica, which covers all of Australia’s Antarctic Territory. At 42% of the continent, it is the largest territory of Antarctica claimed by any nation.
Australia should play a leading role in the urgent science to better understand the susceptibility of the East Antarctic Ice Sheet to global warming. We need to know how much and how fast it will continue changing. Predicting how much this region will contribute to sea-level rise is critical to the welfare of the global community.14
Australia can show international leadership by planning for multi-year international fieldwork on ice and ocean to accelerate our knowledge of risk in East Antarctic ice basins where there are currently major gaps in information.
There is a lack of understanding of both gains and losses of ice tied to snowfall, melt and discharge. Ongoing monitoring of ice mass loss is needed, to know where change is underway, as well as observations to refine model predictions. We also need to improve ice sheet models by incorporating the missing physics and feedbacks with other climate systems.
International collaboration can set up an early-warning system for Antarctic change with a network of automated sensors, such as ocean moorings to detect warm water and on-ice stations for tracking ice flow and melt rates.
A second ship for logistics, in addition to the icebreaker RSV Nuyina along with dedicated aircraft, autonomous instruments and remote field camps, would enable Australia to deliver this necessary science.
What must we do?
Under high-emissions scenarios – even without high-uncertainty inputs from the Antarctic ice sheet kicking in – all coastal capital cities in Australia face a likely increase in sea level of around 80 centimetres by 210015 , and more than a metre at the upper range. Knowledge gained from Antarctic science will help all coastal communities and infrastructure managers to prepare for rates of sea-level rise that are growing faster and will intensify human and economic impacts.
Alongside adaptation, we need to make deep, rapid and sustained reductions of greenhouse gas emissions to limit further sea-level rise acceleration and projected long-term sea-level rise commitment.16 Delays in reaching peak carbon emissions over the coming decades will substantially increase the cost of adapting to higher sea-level rise over the coming centuries.17
The Paris Agreement aims to limit global warming this century, ideally to 1.5°C and less than 2°C above pre-industrial levels. In 2023, Earth was already about 1.36°C warmer than in the late 19th-century. By 2030, global emissions should be half of what they are today for any chance of limiting warming to no more than 2°C.
But even with a temperature limit, the rate at which the Antarctic ice sheet will continue to be lost remains deeply uncertain. Runaway ice loss causing rapid and catastrophic sea-level rise is possible within our lifetimes. Whether such tipping points have already passed is unknown.
This possibility underlines the key imperative: we must set and meet targets to ‘bend the carbon curve’ as quickly as possible. Failure to rapidly reduce emissions — every year and every tonne — commits future generations to greater sea-level rise. Every fraction of a degree matters.
References
[1] NASA Vital Signs: Sea Level
[2] Taherkhani, M., Vitousek, S., Barnard, P.L. et al. (2020) Sea-level rise exponentially increases coastal flood frequency. Sci Rep 10, 6466 https://doi.org/10.1038/s41598-020-62188-4
[3] IPCC Assessment Report 6
[4] IPCC Assessment Report 6, Working Group 1 , Cross Chapter 9.1 Figure 1
[5] IPCC Special Report on the Ocean and Cryosphere in a Changing Climate
[6] Shiklomanov, I (1993) In World fresh water resources In Water in Crisis: A guide to the World’s Fresh Water Resources, Ed: P. H. Gleick
[7] Fretwell, P. et al. (2013) Bedmap2: improved ice bed, surface and thickness datasets for Antarctica. Cryosphere 7, 375–393
https://doi.org/10.5194/tc-7-375-2013
[8] Siegert, M (2024) How we know Antarctica is losing more ice, Bulletin of the Atomic Scientists, vol. 80, no. 4, 239-245 https://www.tandfonline.com/doi/full/10.1080/00963402.2024.2364507
[9] Velicogna, I., Mohajerani, Y., A, G., Landerer, F., Mouginot, J., Noel, B., et al. (2020). Continuity of ice sheet mass loss in Greenland and Antarctica from the GRACE and GRACE Follow-On missions. Geophysical Research Letters, 47, e2020GL087291 https://doi.org/10.1029/2020GL087291
[10] Stokes, C.R., Abram, N.J., Bentley, M.J. et al. (2022) Response of the East Antarctic Ice Sheet to past and future climate change. Nature 608, 275–286 https://doi.org/10.1038/s41586-022-04946-0
[11] Li, Z., England, M.H. & Groeskamp, S. (2023) Recent acceleration in global ocean heat accumulation by mode and intermediate waters. Nature Commun 14, 6888 https://doi.org/10.1038/s41467-023-42468-z
[12] Galton-Fenzi, B.K., H. A. Fricker, J.N. Bassis, A.J. Crawford, N. Gomez and C. Schoof. (in press) The Antarctic Ice Sheet and sea level: contemporary changes and future projections, in M. Meredith, J. Melbourne-Thomas, M. Raphael and A. Naveira Garabato (eds), "Antarctica and Planet Earth", Taylor & Francis Group. https://doi.org/10.4324/9781003406471
[13] F. Pattyn, L. Favier, S. Sun, G. Durand (2017) Progress in numerical modeling of Antarctic ice-sheet dynamics (2017) Curr. Clim. Change Rep., 3, pp. 174-184
[14] Pelle, T., Morlighem, M., & McCormack, F. S. (2020) Aurora Basin, the weak underbelly of East Antarctica. Geophysical Research Letters, 47, e2019GL086821 https://doi.org/10.1029/2019GL086821
[15] NASA sea level projection tool , relative to 1995-2014 baseline
[16] IPCC (2023). Climate Change 2023: Synthesis Report
[17] IPCC (2021): Summary for Policymakers. In: Climate Change 2021: The Physical Science Basis. Contribution of Working Group I to the Sixth Assessment Report of the Intergovernmental Panel on Climate Change: “In the longer term, sea level is committed to rise for centuries to millennia due to continuing deep-ocean warming and ice-sheet melt and will remain elevated for thousands of years (high confidence). Over the next 2000 years, global mean sea level will rise by about 2 to 3 m if warming is limited to 1.5°C, 2 to 6 m if limited to 2°C and 19 to 22 m with 5°C of warming, and it will continue to rise over subsequent millennia (low confidence).”
Contributors:
Prof Nathan Bindoff, Prof Matt King, Prof Poul Christoffersen, Dr Ben Galton-Fenzi, Dr Sue Cook, Dr Chen Zhao
Produced by Mark Horstman, AAPP
Cite as: Horstman, M., Christoffersen, P., Galton-Fenzi, B., Cook, S., Zhao, C., Bindoff, N. and King, M. (2024) Opening the floodgates: A science briefing on Antarctica and sea-level rise. Australian Antarctic Program Partnership and the ARC Australian Centre for Excellence in Antarctic Science, Hobart, Australia (first published September 2024)
Contact: Australian Antarctic Program Partnership, Institute for Marine and Antarctic Studies Private Bag 129, University of Tasmania, Hobart Tasmania 7001
Email: aapp.enquiries@utas.edu.au
